
Prometheus automatic scraping is a game-changer for Kubernetes environments: it dynamically discovers metrics exporter endpoints without requiring manual configuration every time a new workload drops. But what happens when your core infrastructure relies on databases or legacy services running outside the cluster?
While this setup was natively designed for internal Kubernetes workloads, you can successfully extend automatic scraping to external servers. You do not need to abandon Kubernetes-native abstractions or hardcode static scrape targets in your Prometheus configuration.
External Services Discovery With Prometheus ServiceMonitor demonstrates how to exploit the Prometheus Operator's ServiceMonitor to dynamically discover and scrape metrics from external servers. As a practical example, we will configure a production-grade monitoring pipeline for external PostgreSQL nodes and system metrics, implementing enterprise security best practices along the way.
The Challenge of Monitoring Resilient Infrastructures
Traditional OS monitoring tools are not well-suited for modern cloud environments and Kubernetes, as they typically struggle with scalability, flexibility, and handling the highly dynamic infrastructure these environments introduce.
To overcome these shortcomings, SoundCloud developed Prometheus in 2012 - a performance monitoring and alerting solution specifically designed to address the challenges of monitoring complex and dynamic environments such as microservices architectures and cloud-native applications.
What Is Prometheus
Released as an open-source project, Prometheus was designed to provide a reliable and scalable solution for efficiently collecting and storing time-series data. Its decentralized, single-node architecture simplifies deployment, and high availability can be achieved through clustering tools like Thanos or Cortex, integrating seamlessly with container orchestration platform like Kubernetes. Beyond simple metric collection, Prometheus supports built-in alerting capabilities, allowing users to define alert rules based on query results and send notifications through various channels.
Prometheus uses a multi-dimensional data model with key-value pairs called labels, enabling powerful and flexible querying. It scrapes metrics from instrumented jobs, stores them locally, and supports a powerful query language called PromQL for real-time data analysis. Additionally, it integrates easily with Grafana, allowing users to visualize collected metrics in rich, customizable dashboards. These dashboards help developers and operators gain deep insights into system performance and health quickly and effectively.
In 2016, Prometheus became a graduated project of the Cloud Native Computing Foundation (CNCF), reflecting its widespread adoption and maturity within the cloud-native ecosystem.
Today, Prometheus and Grafana form a widely used monitoring stack across industries, helping teams ensure reliability and optimize performance in complex distributed systems.
The Exporters
When dealing with applications specifically instrumented for Prometheus, it scrapes performance metrics directly from exporter endpoints that are natively provided by the instrumented application itself.
To address the use case of monitoring applications not natively instrumented for Prometheus, there are off-the-shelf exporters that can be run as agents. These exporters connect to the monitored application and act as bridges, translating internal metrics into Prometheus-compatible data. By using exporters, it is possible to monitor a wide range of components such as operating systems, databases, hardware, and third-party services. For example, the Node Exporter collects hardware and OS-level metrics from Linux servers, while other exporters target specific applications or services.
Common Prometheus exporters include:
- Node Exporter (system metrics)
- Blackbox Exporter (endpoint probing)
- PostgreSQL Exporter (database metrics)
- MySQL Exporter
- Kafka Exporter
- JMX Exporter (Java applications)
To see these concepts in action, we will spin up a lab installing the Prometheus Node Exporter and PostgreSQL Exporter on a host running PostgreSQL server.
Node Exporter
Prometheus Node Exporter is a lightweight Linux agent designed to be efficient and have minimal impact on system performance. It exposes hardware and OS-level metrics, providing system information such as CPU usage, memory consumption, disk I/O, and network statistics.
Since it is not distributed as an RPM package, we must proceed manually by downloading and installing it as follows:
cd /opt
sudo wget https://github.com/prometheus/node_exporter/releases/download/v1.9.1/node_exporter-1.9.1.linux-amd64.tar.gz
sudo tar xfvz node_exporter-1.9.1.linux-amd64.tar.gz
sudo rm -f node_exporter-1.9.1.linux-amd64.tar.gz
sudo ln -s node_exporter-1.9.1.linux-amd64/ node_exporter
sudo chown -R root: /opt/node_exporter-1.9.1.linux-amd64
In this example, we downloaded the zipped tarball of Prometheus Node Exporter version 1.9.1 for the x86_64 architecture, extracted it under the /opt directory into a folder having the Node Exporter version in its name, and created a symbolic link at /opt/node_exporter pointing to that folder. This approach provides a quick and easy rollback to the previous version during upgrades, if problems arise. In compliance to security best practices, we reassigned ownership of the entire directory tree to the root user.
After completing the installation, we can move to the next step and create the node_exporter system user to use for running it as a service.
sudo useradd -M -r -s /sbin/nologin node_exporterThe last step is adding the corresponding Systemd unit.
Create the file /etc/systemd/system/node_exporter.service with the following contents:
[Unit]
Description=Prometheus exporter for System
Wants=network-online.target
After=network-online.target

[Service]
User=node_exporter
Group=node_exporter
WorkingDirectory=/opt/node_exporter
ExecStart=/opt/node_exporter/node_exporter --web.listen-address=:9100 --web.telemetry-path=/metrics
Restart=always

[Install]
WantedBy=multi-user.target
Once done, reload Systemd to make it aware of the new node_exporter unit:
sudo systemctl daemon-reloadSince Node Exporter listens on port tcp/9100, we must also create a firewall exception:
sudo firewall-cmd --permanent --add-rich-rule="rule family='ipv4' port port='9100' protocol='tcp' accept"
sudo firewall-cmd --reload
We can now start the node_exporter service and enable it to automatically start at system boot:
sudo systemctl enable --now node_exporter
sudo systemctl status node_exporter
You may want to also have a look to Monitoring Linux host metrics with the Node Exporter from the official Prometheus documentation.
PostgresQL Exporter
Prometheus PostgreSQL Exporter is a lightweight agent that collects and exposes database metrics from PostgreSQL servers. It monitors key performance indicators such as query performance, connection counts, and cache usage to help track database health and efficiency.
Since it needs to connect to the PostgreSQL instance to perform its checks, it is necessary to create a dedicated PostgreSQL user.
To achieve this, switch to the postgres user:
sudo su - postgresand open the PostgreSQL console:
psqlwe can now create the postgres_exporter user, granting the pg_monitor role to it:
CREATE USER postgres_exporter WITH ENCRYPTED PASSWORD 'thepassword';
GRANT pg_monitor TO postgres_exporter;
just mind to replace the password in this example with a secure one.
According to the security best practice of running services using the least necessary rights, we also create the postgres_exporter system user, so to run the PostgreSQL Exporter service as it:
sudo useradd -M -r -s /sbin/nologin postgres_exporterWe can now proceed with the installation of the exporter.
Same way as we did for the Node Exporter, since PostgreSQL Exporter too is not distributied as an RPM package, we must proceed manually - download and install it as follows:
cd /opt
sudo wget  https://github.com/prometheus-community/postgres_exporter/releases/download/v0.17.1/postgres_exporter-0.17.1.linux-amd64.tar.gz
sudo tar xfvz postgres_exporter-0.17.1.linux-amd64.tar.gz
sudo rm -f postgres_exporter-0.17.1.linux-amd64.tar.gz
sudo ln -s postgres_exporter-0.17.1.linux-amd64 postgres_exporter
sudo chown -R root: /opt/postgres_exporter-0.17.1.linux-amd64
In this example, we downloaded the zipped tarball of Prometheus PostgreSQL Exporter version 0.17.1 for the x86_64 architecture, extracted it under the /opt directory into a folder having the PostgreSQL Exporter version in its name, and created a symbolic link at /opt/postgres_exporter pointing to that folder. Accordingly to the security best practices, we reassigned ownership of the entire directory tree to the root user.
After completing the installation, the next step is to add the corresponding Systemd unit.
Since this exporter requires a few settings, we must first create the /opt/postgres_exporter/.env environment file with the following contents:
DATA_SOURCE_NAME="postgresql://postgres_exporter:thepassword@localhost:5432/postgres?sslmode=disable"of course asjust the password to match the one you set while creating the postgres_exporter user in PostgreSQL.
We must then secure the environment file so that only the postgres_exporter user can access it:
sudo chmod 640 /opt/postgres_exporter/.env
sudo chown postgres_exporter: /opt/postgres_exporter/.env
Since we will configure PostgreSQL Exporter to listen on port tcp/9187, we must also create a firewall exception:
sudo firewall-cmd --permanent --add-rich-rule="rule family='ipv4' port port='9187' protocol='tcp' accept"
sudo firewall-cmd --reload
We can finally create the /etc/systemd/system/postgres_exporter.service file with the following contents:
[Unit]
Description=Prometheus exporter for Postgresql
Wants=network-online.target
After=network-online.target

[Service]
User=postgres_exporter
Group=postgres_exporter
WorkingDirectory=/opt/postgres_exporter
EnvironmentFile=/opt/postgres_exporter/.env
ExecStart=/opt/postgres_exporter/postgres_exporter --auto-discover-databases --web.listen-address=:9187 --web.telemetry-path=/metrics
Restart=always

[Install]
WantedBy=multi-user.target
Once done, reload Systemd to make it aware of the new postgres_exporter unit:
sudo systemctl daemon-reloadWe can now start the postgres_exporter service and enable it to automatically start at system boot:
sudo systemctl enable --now postgres_exporter
sudo systemctl status postgres_exporter
Automatic Discovery Of Prometheus Exporters
Prometheus discover the service endpoints providing the Prometheus metrics by leveraging on a few Kubernetes objects: Pods, Services, Endpoints, and ServiceMonitors.
The interaction between these components works as follows:
- Pods expose its process endpoint on a specific port
- Service groups the Pods's process endpoint and exposes a stable network endpoint which survives Pod's lifecycle
- Endpoint is a logical object with the mappings used by Service to balance to its backend's Pods.
- ServiceMonitor is a logical object which defines how Prometheus should discover and scrape metrics from Services
When dealing with Prometheus, each monitored application provides either exporter pod or a path to its http (or https) endpoint dedicated to this.
To illustrate the whole process, consider a Service defined with the label app: prometheus-exporters that exposes port 9100. A corresponding ServiceMonitor selects this Service using the same label and configures Prometheus to scrape the /metrics path on port 9100 every 30 seconds. Prometheus then discovers the Service via the ServiceMonitor and scrapes the metrics from the actual Pods listed in the Endpoints.
This setup allows Prometheus to dynamically discover and scrape metrics from exporters running in Kubernetes without manual intervention, leveraging Kubernetes-native abstractions and the Prometheus Operator’s automation.
In our scenario, although we are not dealing with Kubernetes exporter pods, we are exploiting the the same process: the only difference is that, since in our scenario the backends are running on nodes external to the Kubernetes cluster, the Endpoint object cannot be manually managed by Kubernetes, and we must manually manage it ourselves.
Kubernetes Services
As said, a Kubernetes Service is an abstraction layer that groups a set of Pods and provides a stable network endpoint to access them: it select the back-end based on labels and exposes them on a specific port. In a typical Kubernetes scenario, back-ends are Pods: since they have not a predictable IP address, Services are used to provide clients a stable endpoint allowing to access the Pods behind it.
In this example, we create a Service named prometheus-exporters without a pod selector. This tells Kubernetes that we will provide the endpoints manually.
In this fictional scenario, we are simulating postgresql services belonging to the production environment (p), security tier 1, hence the use of the name postgresp-01 for the namespace. This enable an easy filtering of the provided metrics, for example when using Grafana.
This landscape is summarized by the below graphic:
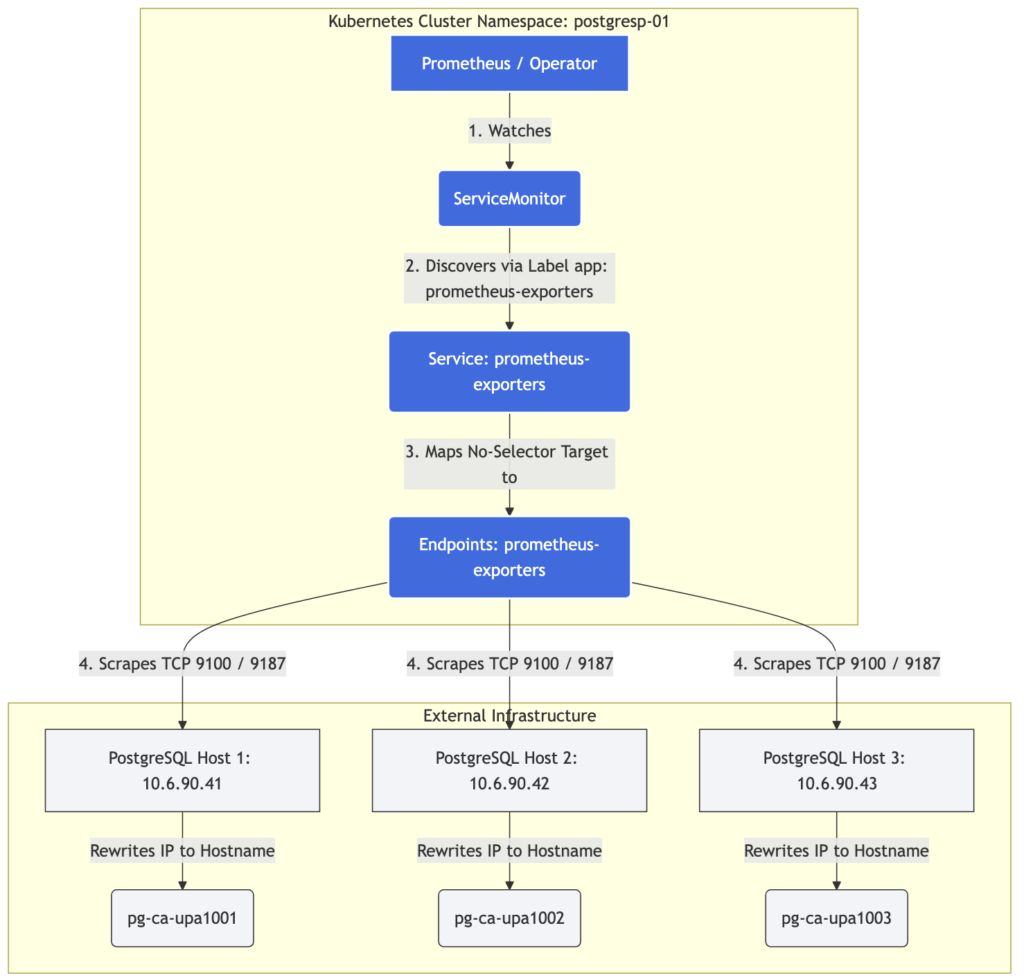
In this example we define only these two exporter endpoints:
- system-metrics, listening on port TCP/9100, having target endpoints on port TCP/9100
- postgres-metrics, listening on port TCP/9187, having target endpoints on port TCP/9187
apiVersion: v1
kind: Service
metadata:
  name: prometheus-exporters
  namespace: postgresp-01
  labels:
    app: prometheus-exporters
spec:
  ports:
    - name: system-metrics
      port: 9100
      protocol: TCP
      targetPort: 9100
    - name: postgres-metrics
      port: 9187
      protocol: TCP
      targetPort: 9187
Once done with the actual exporters services, we must configure a Kubernetes service.
Kubernetes Service Endpoint
As said, when creating a service, behind the scenes, Kubernetes automatically creates an Endpoints object for each Service. This Endpoints resource contains the actual IP addresses and ports of the Pods that match the Service’s selector. Essentially, while the Service provides a stable front, the Endpoints represent the real network locations of the Pods.
In our scenario, since the backed services are outside the Kubernetes cluster, we cannot rely on Kubernetes for automatically managing the Endpoint object, and we must instead create the mapping manually.
Create the Endpoints manifest with the following contents:
apiVersion: v1
kind: Endpoints
metadata:
  name: prometheus-exporters
  namespace: postgresp-01
subsets:
  - addresses:
    - hostname: pg-ca-up1a001
      ip: 10.6.90.41
    - hostname: pg-ca-up1a002
      ip: 10.6.90.42
    - hostname: pg-ca-up1a003
      ip: 10.6.90.43
    ports:
    - name: system-metrics
      port: 9100
      protocol: TCP
    - name: postgres-metrics
      port: 9187
      protocol: TCP
In this example we are configuring the prometheus-exporter Endpoints in the postgresp-01 namespace.
It defines the following endpoints:
- system-metrics, listening on port TCP/9100 and mapping to backends hosts on port TCP/9100
- postgres-metrics, listening on port TCP/9187 and mapping to backends hosts on port TCP/9187
The backend hosts are:
- pg-ca-up1a001 (IP address: 10.6.90.41)
- pg-ca-up1a002 (IP address: 10.6.90.42)
- pg-ca-up1a003 (IP address: 10.6.90.43)

Sadly the endpoints object does not allow to provide the backend hosts' FQDN - the hostname attribute is just a label, and the host is then located by using the provided IP address. This of course means this solution can work only if the backend hosts have a stable IP address, which should not be a real issue with database servers.
Automating external service discovery with ServiceMonitor is a great start, but it is only part of what a DevOps and DevSecOps professional is supposed to be able to do.
If you want to systematically fill your DevOps and DevSecOps knowledge gaps by reading a crash-course like book full of hands-on enterprise exercises, jump directly to the Apress Blueprint Box below to discover how to boost and evolve your career using a self-paced learning path.
Kubernetes ServiceMonitor
A ServiceMonitor is a custom resource introduced by the Prometheus Operator to simplify and automate the configuration of Prometheus scrape targets. Instead of manually configuring Prometheus to scrape individual targets, a ServiceMonitor defines how Prometheus should discover and scrape metrics from Kubernetes Services.
To identify which Services to scrape, a ServiceMonitor uses label selectors to match Services with specific labels. Since a Service can expose multiple endpoints (ports), the ServiceMonitor specification includes details such as the target port, metrics path, scrape interval, and other scrape-related settings.
During operation, the Prometheus Operator continuously watches for ServiceMonitor resources and dynamically updates the Prometheus configuration to reflect any changes, ensuring that Prometheus scrapes the appropriate targets as defined by the ServiceMonitors.
Going further with our scenario, we can now define the ServiceMonitor instance:
apiVersion: monitoring.coreos.com/v1
kind: ServiceMonitor
metadata:
  name: prometheus-exporters
  namespace: postgresp-01
  labels:
    app: prometheus-exporters
spec:
  endpoints:
    - honorLabels: true
      relabelings:
        - action: replace
          regex: ^10\.6\.90\.41:\d+$
          replacement: pg-ca-up1a001
          sourceLabels:
            - instance
          targetLabel: instance
        - action: replace
          regex: ^10\.6\.90\.42:\d+$
          replacement: pg-ca-up1a002
          sourceLabels:
            - instance
          targetLabel: instance
        - action: replace
          regex: ^10\.6\.90\.43:\d+$
          replacement: pg-ca-up1a003
          sourceLabels:
            - instance
          targetLabel: instance
      path: /metrics
      port: system-metrics
    - honorLabels: true
      relabelings:
        - action: replace
          regex: ^10\.6\.90\.41:\d+$
          replacement: pg-ca-up1a001
          sourceLabels:
            - instance
          targetLabel: instance
        - action: replace
          regex: ^10\.6\.90\.42:\d+$
          replacement: pg-ca-up1a002
          sourceLabels:
            - instance
          targetLabel: instance
        - action: replace
          regex: ^10\.6\.90\.43:\d+$
          replacement: pg-ca-up1a003
          sourceLabels:
            - instance
          targetLabel: instance
      path: /metrics
      port: postgres-metrics
  namespaceSelector:
    matchNames:
      - postgresp-01
  selector:
    matchLabels:
      app: prometheus-exporters
In this example, we are configuring a ServiceMonitor named prometheus-exporters in the postgresp-01 namespace. This ServiceMonitor scrapes Prometheus exporter metrics from Services labeled with prometheus-exporters.
It provides the necessary configuration to scrape the following endpoints (ports):
- system-metrics: This corresponds to the system-metrics frontend endpoint in the discovered prometheus-exporter Service.
- postgres-metrics: This corresponds to the postgres-metrics frontend endpoint in the discovered prometheus-exporter Service
Both endpoints expose metrics at the /metrics path.
In our specific scenario, since the monitored services are located outside Kubernetes cluster, the endpoints also include relabeling rules tailored for each host running the exporter service.
This is necessary because the remote endpoints are referenced by their IP addresses. Without this relabeling, Prometheus would store the node providing the metrics using its IP address, which is not user-friendly or easy to remember.
By rewriting the IP addresses into hostnames, it becomes easier for humans to identify the actual services, eliminating the need to consult external documentation for IP-to-hostname lookups.
Note the use of the `:\d+$` regex in the matching pattern (e.g., `^10\.6\.90\.41:\d+$`). In Prometheus, the `instance` label natively includes both the IP and the port number (e.g., `10.6.90.41:9100`). This specific regex dynamically captures any port attached to that IP, allowing a single relabeling rule to cleanly rewrite the instance name regardless of whether it is scraping system or PostgreSQL metrics.
From Observability to DevOps and DevSecOps
Mastering ServiceMonitor and dynamic scraping is an essential yet advanced DevOps skill.
However, DevOps is much more of just knowing how to configure fancy tools for specific landscapes: despite the common DevOps Engineer job titles, true DevOps professionals act more like technical architects: they need a holistic mix of development, security (DevSecOps), and system engineering to bridge teams together.
My book, "DevSecOps and DevOps for Linux: The Foundations", published by Apress, was specifically designed for professionals who want to eliminate tech stack gaps through intensive, hands-on enterprise exercises — built entirely on open-source, cloud-agnostic architectures to ensure zero vendor lock-in.
Key insights covered in this volume:
- The Holistic Skills Set Brick: Bridge technical engineering with team management frameworks. Master
Scrum,Kanban, andLeanmethodologies to design system architectures aligned with real corporate workflows. - The Shell Scripting & Unix Tools Brick: Build rigorous operational foundations. Master advanced
Bashshell scripting architecture while learning how to combine core Unix tools into robust, repeatable, and enterprise-ready host automations. - The Version Control Engineering Brick: Move past basic commits. Dive deep into
Gitversion control, mastering feature-branch workflows, repository lifecycle management, and complex conflict resolution. - The Data & Core Automation Brick: Build bulletproof data processing setups. Learn advanced
RegEx, how to operate using evergreen tools such asGrep,Sed, andAWK, and how to master structured data parsing (XML,JSON,YAML) usingPythonand tools likexmlstarlet,jq, andyq. - The Modern Python & Automation Brick: Develop a modern Python project using
pyproject.tomlwithpytest-based unit tests, governing the project withGNU Makefor testing, building, and digitally signingRPMpackages. The project is presented in an evolving fashion, showing how features are added step by step, highlighting how a properly structured Python project can be improved and evolved with minimal or no rework at all. - The Linux OS Hardening & PKI Brick: Learn the real mechanics of security. Implement
X.509/PKIarchitectures,TLSconfigurations, andGPGencryption and signing, while mastering low-level kernel defenses likeSELinuxandLinux Capabilities. - The Compliance Check and Shift-Left Security Brick: Learn how to leverage the
pre-commitframework to automate compliance checks withPylintandFlake8, and perform security scans withBanditandSafety, extending the security audit to the full software supply chain. - The Application Integration Brick: Master the foundational protocols used to securely interconnect enterprise microservices, including
HTTP,REST,OpenAPI,SOAP, andLDAP/LDAPS. - The Infrastructure Delivery Brick: Put theory into practice with vertical, real-world labs. Move from basic scripts to engineering
Ansiblearchitectures, rootlessPodmansetups, image creation viaBuildah, and completePulp3deployments usingDocker Compose. - The Enterprise GitOps Pipeline Brick: Tie everything together by automating your software supply chain. Build complete continuous deployment workflows using
Gitea CIpipelines hosted natively onKubernetes(RKE2).
Footnotes
Here we end this post on configuring the automatic scraping of Kubernetes metrics from services running outside the Kubernetes. To summarize, as we said, when running Prometheus in a Kubernetes cluster, using ServiceMonitor is particularly useful for automatically discovering and scraping metrics from exporter endpoints.
ServiceMonitor allows Prometheus to dynamically identify target services based on label selectors, eliminating the need for manual configuration of external scrape targets. This automation simplifies management and ensures that Prometheus’s configuration stays up to date as external services change.
With a little effort, it is possible to exploit this mechanism also to discover exporter services running outside the cluster, exploiting the fact that ServiceMonitor supports relabeling rules to translate IP addresses of external endpoints into human-readable hostnames, making it easier to interpret and manage the collected metrics.
Overall, ServiceMonitor streamlines the integration of external exporters with Prometheus running inside Kubernetes, enhancing observability with minimal manual effort
I hope this helepd you to figure out how to implement this in your environment.
If you appreciate this strive please and if you like this post and any other ones, just share this and the others on Linkedin - sharing and comments are an inexpensive way to push me into going on writing - this blog makes sense only if it gets visited.